Application
🧭 Purpose
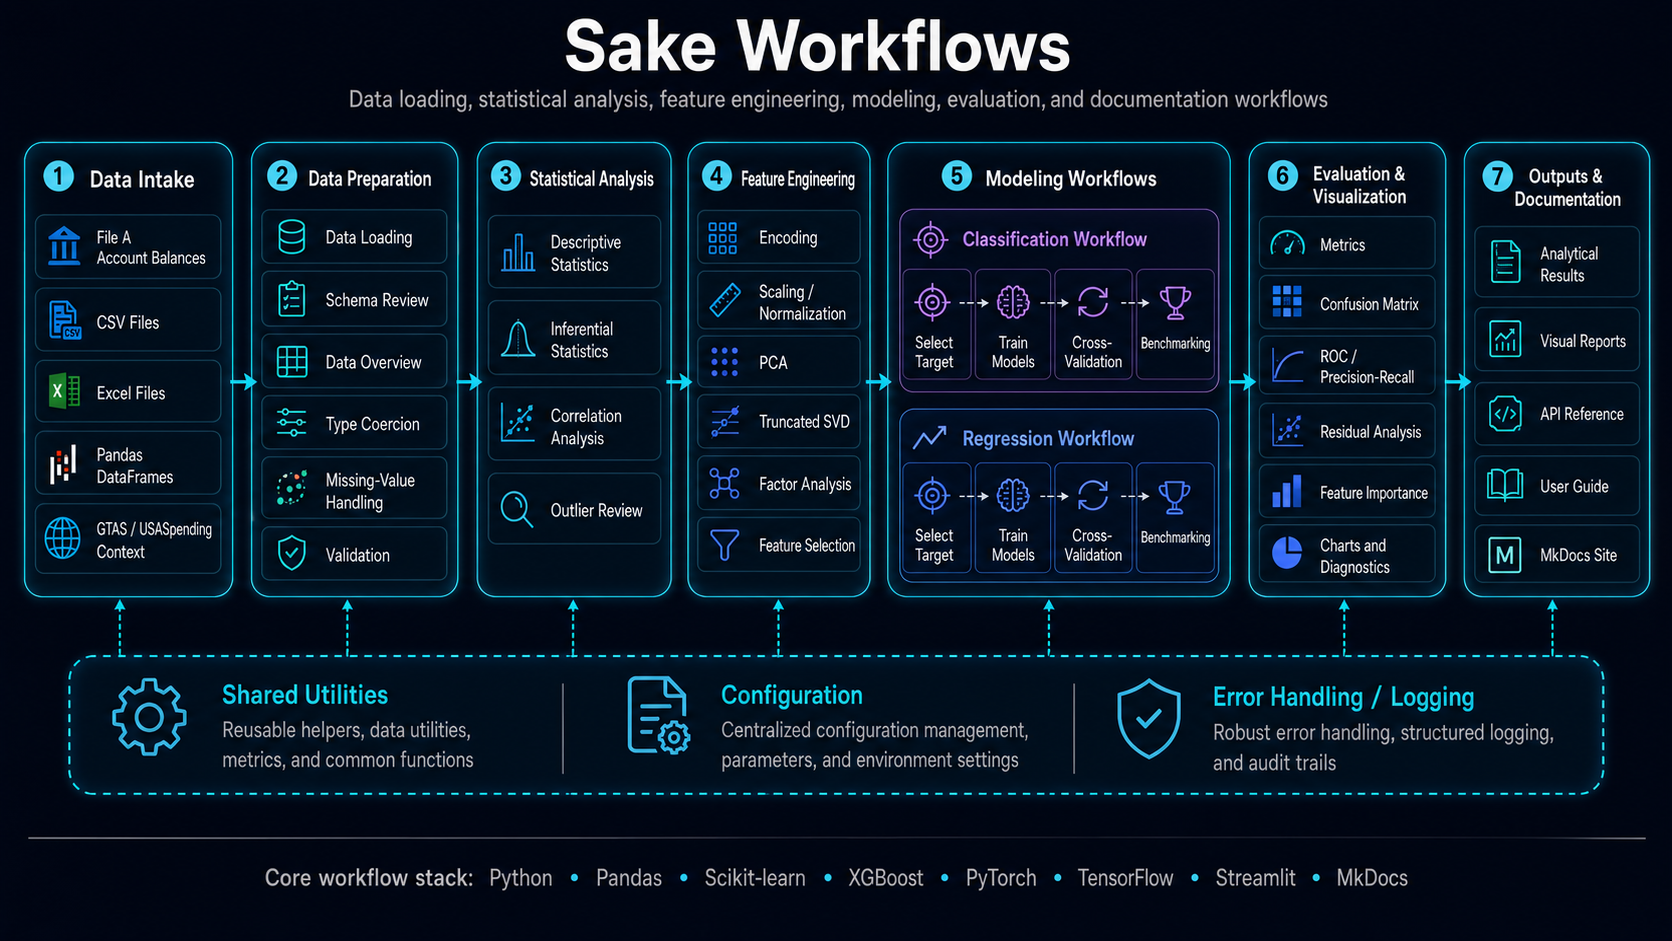
The app module is the interactive entry point for Sake. It should coordinate the Streamlit interface, data upload flow, workflow selection, statistical analysis controls, feature-engineering options, model-training actions, evaluation output, and visualization rendering.
This page documents the application-facing layer and should remain focused on orchestration rather than duplicating business logic that belongs in data, statistics, features, models, evaluation, or visualization modules.
🧱 Workflow Role
| Area | Responsibility |
|---|---|
| Page setup | Configure page layout, title, sidebar controls, and user-facing workflow sections. |
| Upload handling | Accept Account Balances, CSV, Excel, or notebook-provided datasets. |
| Workflow routing | Route user choices to statistics, features, models, evaluation, and visualization modules. |
| State management | Preserve uploaded data, selected options, transformed features, trained models, and generated outputs. |
| Output rendering | Present previews, metrics, diagnostic plots, warnings, and model-comparison results. |
🔄 Application Flow
✅ Implementation Expectations
- Keep reusable analytical logic outside the UI layer.
- Avoid unsafe module-level execution that prevents
mkdocstringsfrom importingapp. - Initialize session-state keys before they are read.
- Use stable labels for Account Balances, budget execution, model type, target field, and evaluation output.
- Keep plotting and metric calculations in dedicated modules when possible.
🧪 Validation Checklist
| Check | Purpose |
|---|---|
python -m compileall . |
Confirm the application module and dependencies compile. |
python -c "import app" |
Confirm mkdocstrings can import the module. |
streamlit run app.py |
Confirm the interactive interface launches. |
mkdocs build |
Confirm the API page renders without import or griffe errors. |
📚 Source Reference
app 
styled_scatter 
styled_scatter(
    ax: Axes,
    x: ndarray,
    y: ndarray,
    series_index: int = 0,
    label: Optional[str] = None,
    size: int = 30,
) -> None
Purpose:
Draw a consistently styled scatter plot with clear point boundaries and visually distinct series.
Parameters:
ax : plt.Axes Matplotlib axes to draw on. x : np.ndarray X-coordinates of the points. y : np.ndarray Y-coordinates of the points. series_index : int, optional Index used to pick color and marker from predefined palettes. label : Optional[str], optional Legend label for the series, if any. size : int, optional Marker size for the scatter plot.
Returns:
None This function draws on the provided axes in-place.
Source code in app.py
auto_float_format 
Purpose:
Infer a reasonable float formatting pattern for a numeric series based on its scale, so large values are readable and decimals are not excessive.
Parameters:
series : pd.Series Series whose numeric magnitude is used to pick the format. max_decimals : int, optional Maximum number of decimal places allowed in the format string.
Returns:
str A Python format string such as '{:,.2f}' appropriate for the series.
Source code in app.py
render_table 
render_table(
    df: DataFrame,
    title: Optional[str] = None,
    caption: Optional[str] = None,
    precision: int = 4,
    dark_mode: bool = True,
    max_rows: int = 500,
) -> None
Purpose:
Render a pandas DataFrame as a styled HTML table suitable for Streamlit, avoiding raw JSON output.
Parameters:
df : pd.DataFrame DataFrame to render. title : Optional[str], optional Optional section title to display above the table. caption : Optional[str], optional Descriptive caption explaining the table content. precision : int, optional Maximum decimal precision for numeric columns. dark_mode : bool, optional If True, use dark-themed table colors; otherwise light theme. max_rows : int, optional Maximum number of rows to display; additional rows are truncated.
Returns:
None The function writes directly to the active Streamlit app.
Source code in app.py
140 141 142 143 144 145 146 147 148 149 150 151 152 153 154 155 156 157 158 159 160 161 162 163 164 165 166 167 168 169 170 171 172 173 174 175 176 177 178 179 180 181 182 183 184 185 186 187 188 189 190 191 192 193 194 195 196 197 198 199 200 201 202 203 204 205 206 207 208 209 210 211 212 213 214 215 216 217 218 219 220 221 222 223 224 225 226 227 228 229 230 231 232 233 234 235 236 237 238 239 240 241 242 243 244 245 | |
safe_numeric_series 
Purpose:
Convert a DataFrame column to a clean numeric NumPy array, dropping any non-numeric or missing values.
Parameters:
df : pd.DataFrame Source DataFrame containing the column. col : str Name of the column to convert.
Returns:
np.ndarray One-dimensional array of float values with NaNs removed.
Source code in app.py
descriptive_profile 
Purpose:
Compute an extended descriptive statistics profile for a set of numeric columns, including tails, dispersion measures, and simple outlier rates.
Parameters:
df : pd.DataFrame DataFrame containing the numeric columns. cols : List[str] List of column names to profile.
Returns:
pd.DataFrame DataFrame with one row per feature and many descriptive statistics columns (mean, std, quantiles, skew, kurtosis, outlier rates, etc.).
Source code in app.py
271 272 273 274 275 276 277 278 279 280 281 282 283 284 285 286 287 288 289 290 291 292 293 294 295 296 297 298 299 300 301 302 303 304 305 306 307 308 309 310 311 312 313 314 315 316 317 318 319 320 321 322 323 324 325 326 327 328 329 330 331 332 333 334 335 336 337 338 339 340 341 342 343 344 345 346 347 348 349 350 351 352 353 354 355 356 357 358 359 360 361 362 363 364 365 366 367 368 369 370 371 372 373 374 375 376 | |
feature_quality 
Purpose:
Summarize data quality signals for each column, such as completeness, uniqueness, and simple variance/entropy indicators.
Parameters:
df : pd.DataFrame DataFrame whose columns are to be evaluated.
Returns:
pd.DataFrame DataFrame with one row per column, including completeness percentage, unique counts, cardinality ratio, and variance/entropy metrics.
Source code in app.py
corr_with_pvalues 
corr_with_pvalues(
    df: DataFrame, cols: List[str], method: str
) -> Tuple[pd.DataFrame, pd.DataFrame]
Purpose:
Compute a correlation matrix and the corresponding matrix of p-values for a set of numeric columns using Pearson or Spearman correlation.
Parameters:
df : pd.DataFrame DataFrame containing the columns of interest. cols : List[str] List of column names to include in the correlation computation. method : str Correlation type; either 'pearson' or 'spearman'.
Returns:
Tuple[pd.DataFrame, pd.DataFrame] Two DataFrames with identical indices/columns: - correlation coefficients - p-values for the corresponding tests.
Source code in app.py
numeric_default_candidates 
Purpose:
Identify numeric columns that are likely to be measures (not IDs or codes) and should be pre-selected in numeric analyses.
Parameters:
df : pd.DataFrame Source DataFrame containing the numeric columns. numeric_cols : List[str] List of all numeric column names inferred from dtypes.
Returns:
List[str] Subset of numeric column names to use as sensible defaults.
Source code in app.py
categorical_default_candidates 
Purpose:
Identify categorical columns that behave like true categories (not near-unique IDs) and are good candidates for pre-selection.
Parameters:
df : pd.DataFrame Source DataFrame containing the categorical columns. cat_cols : List[str] List of column names treated as categorical.
Returns:
List[str] Subset of categorical column names that have reasonable cardinality and should be pre-selected by default.
Source code in app.py
style_subheaders 
Purpose:
Sets the style of subheaders in the main UI